Age Related - Assessed
How does this calculation method work?
On a student-by-student basis, check if the latest assessment for 100% of the assessed objectives is at target status or higher.
If this is not the outcome you are looking for and need to customize your reporting, please skip to Target Calculation.
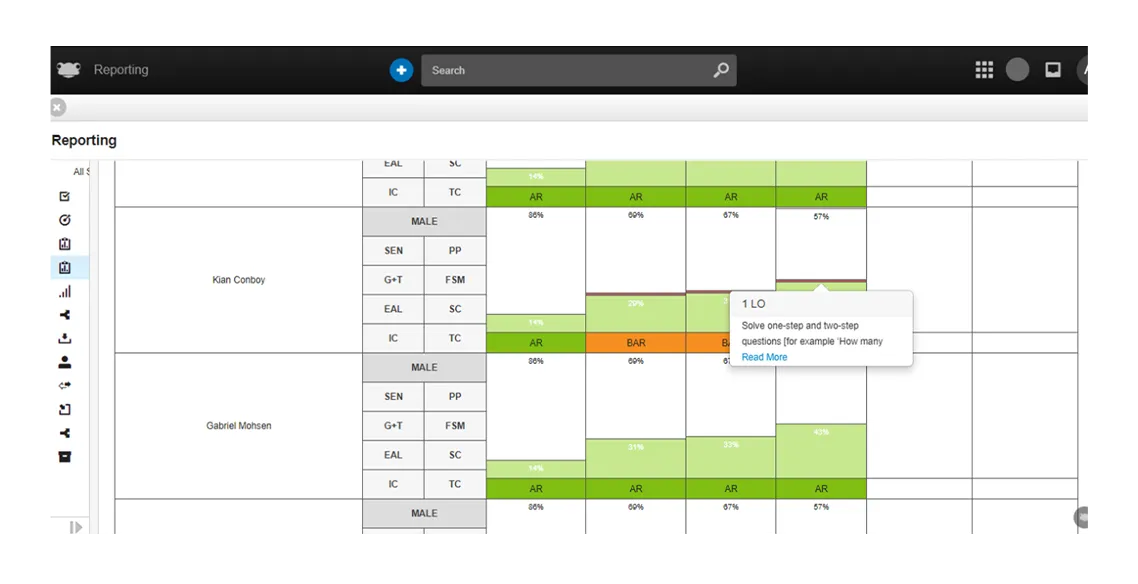
From the report below this snapshot shows during the current assessment period (up to and including Spring 2) The % of Learning Objectives recorded; at or above and those below.
- If they are: the student is AR.
- If there is a single assessment that is below target or if the student has not been assessed against something that has been taught (i.e., they have gaps): the student is BAR.

Figure 1 Age Related Progress - Students vs Time Assessed Group
This report just shows two statuses if the child is at/above, or below. Using the interactive component of the report you can see which Learning Objectives fall into which criteria.
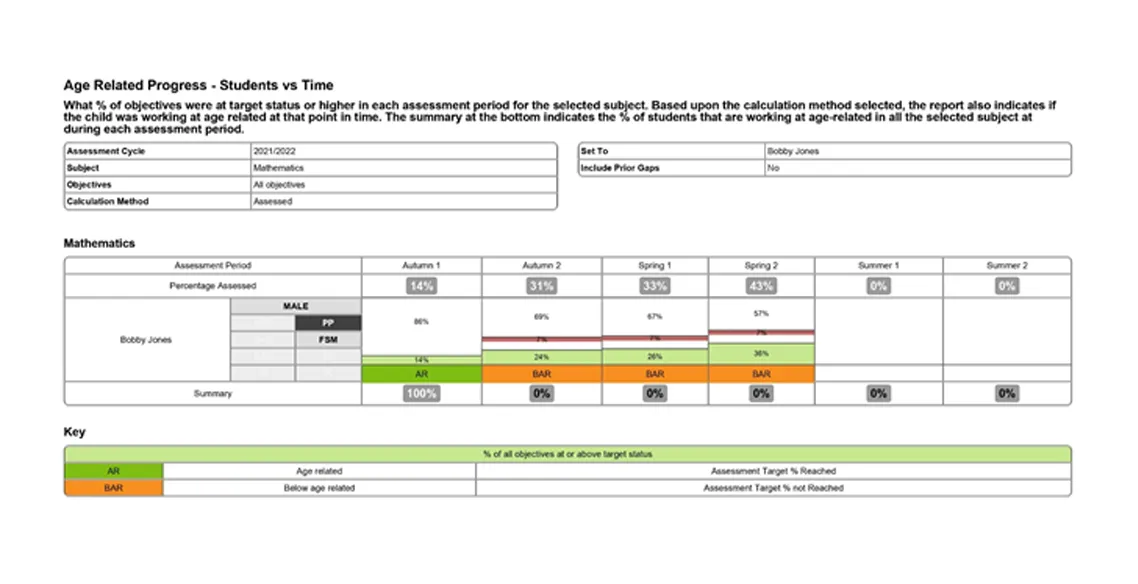
The same report can be run for an individual child, including the child’s contextual data* You can see from the report below The Percentage Assessed, for each period is at the top of the report.

The Summary includes the % at or above Age Related. If this were a group report, you would be able to see this as the % of students in each period that were at/above and those that were BAR.
The summary at the bottom indicates the % of students that are working at age-related in all the selected subject at during each assessment period.


